How We Doin’? (10-Year Edition)
Now that the Powerfund Portfolios are in their tenth year (we created them in March 2002), we think it's a good time to take a look back at our long-term performance.
For those new to our portfolios, a brief history may be in order. You can find a compete history listing all the trades (and our rationale for making them) going back to 2002 .
In early 2002, we launched the model portfolios as a way to apply our MAXfunds rating system to an actual portfolio. Our goal was to offer portfolios with varying levels of risk (at the time, we had five core portfolios and two special-purpose portfolios) for different types of investors, including those with only a few thousand dollars to invest.
Although not customized to meet every need, the portfolios were designed to allow easy allocation by an investor with about $70,000 to allocate. We offered a selection of ETFs, no-load funds, and occasionally, closed-end funds, to allow investors to invest cheaply across the different markets we were trying to target at the time.
We eventually reduced the number of portfolios down to two and moved to "real money," meaning we've invested in the actual portfolios and can now track daily price swings. As a result, our performance now includes real-world implications like commissions, redemption fees, and exchange-traded-fund trading costs.
You'll note the portfolios have always included underlying management fees and expenses from the mutual funds, and since many of the funds were NTF (no transaction fee) and we traded infrequently, it would have been possible to follow our portfolios with minimal actual commissions. The "fake money" years accurately demonstrated the funds' performance while we owned them.
The Powerfund Portfolios strategy involves selecting quality mutual funds and ETFs in categories that have fallen out-of-favor with investors. The idea is that these unpopular funds should perform well, relative to benchmarks and especially versus areas most investors favor. We’re contrarian investors, so we believe the way to succeed is to do what most investors aren’t doing. Popular doesn’t work.
Our trading strategy is longer-term: we typically hold investments for a few years, which maximizes after-tax returns and minimizes trading (and hassle) costs. Buying and holding index funds is even more tax-efficient and lower-cost than what we do, but our results still compare favorably fee and tax wise to other active management options.
10-Year Total & Annualized Returns as of 8/31/2012
| Portfolio | 10-Year Total Ret. | 10-Year Ann. Ret. |
|---|---|---|
| Aggressive | 201.07% | 11.65% |
| Conservative | 106.87% | 7.54% |
| S&P 500 (VFINX, Includes Dividends) | 85.77% | 6.39% |
Not too shabby. Of course, this long-term snapshot doesn’t highlight the significant downside the S&P 500 has experienced twice since 2000. Since we generally owned stock and bond funds that have fared better than the market during down periods, our performance also looks better relative to the benchmarks following stock slides. For example, back when we first hit 10 years, at the end of March 2012, this is how we compared to the S&P 500:
10-Year Total & Annualized Returns as of 3/31/12
| Portfolio | 10-Year Tot. Ret. | 10-Year Ann. Ret. |
|---|---|---|
| Aggressive | 166.60% | 10.30% |
| Conservative | 96.08% | 6.97% |
| S&P 500 (VFINX, Includes Dividends) | 48.24% | 4.02% |
Today’s 10-year S&P 500 history begins near the bottom of the 2000 crash and looks like stocks have delivered great, (although single digit) returns. Back up, say, 12 years, and most stock investors have only just recently broken even again.
Our own returns "since inception" on March 31, 2002 are slightly lower, since the stock market went nearly straight down during our first year.
Performance Snapshot Since Inception
| Portfolio | Total Ret. | Annualized. Ret. |
|---|---|---|
| Aggressive | 171.92% | 10.09% |
| Conservative | 103.05% | 7.04% |
| S&P 500 (VFINX, Includes Dividends) | 49.37% | 3.93% |
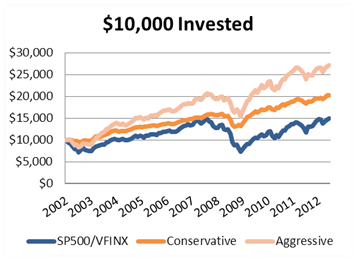
Here's a chart of our since-inception returns compared to the S&P 500 since inception:
Here's a table of our calendar year returns (partial 2002 & 2012) vs. the market:
calendar year returns (partial 2002 & 2012) vs. market:
| Year | VFINX | Conservative | Aggressive |
|---|---|---|---|
| 2012 | 13.40% | 6.82% | 9.26% |
| 2011 | 1.95% | 3.49% | 0.22% |
| 2010 | 14.91% | 7.58% | 9.84% |
| 2009 | 26.49% | 28.23% | 32.17% |
| 2008 | -37.02% | -16.71% | -16.23% |
| 2007 | 5.39% | 9.26% | 11.88% |
| 2006 | 15.64% | 8.14% | 12.13% |
| 2005 | 4.77% | 4.14% | 7.94% |
| 2004 | 10.74% | 9.35% | 14.54% |
| 2003 | 28.50% | 19.54% | 43.78% |
| 2002 | -22.33% | -0.62% | -8.42% |
Here are some performance-related statistics:
Portfolio best/worst
| VFINX | Conservative | Aggressive | |
|---|---|---|---|
| Worst Month | -16.79% (10/08) | -7.27% (10/08) | -7.68% (10/08) |
| Best Month | 10.91% (10/11) | 5.61% (04/09) | 8.71% (04/03) |
| Worst 3 Months | -29.64% (09/08-11/08) | -15.82% (09/08-11/08) | -16.75% (09/08-11/08) |
| Best 3 Months | 25.85% (03/09-05/09) | 15.63 (03/09-05/09) | 23.44% (03/09-05/09) |
So how about our next ten years? The two biggest challenges we face going forward (in replicating past returns) are:
- Investment-grade bond and cash yields are barely above zero, and should stay that way for some time.
- There's less dispersion from the mean – in the sense that even out-of-favor categories aren't that out-of-favor, relative to the in-favor categories. We still expect our funds and categories to beat the averages, but one group probably won’t outperform the others by such wide margins.
Some important notes:
Until 2010, our model portfolio monthly performance was calculated based on the actual performance of the underlying mutual funds, which included fund fees. We didn't consider any commissions that investors might have incurred buying and selling the funds. Of course, such fees could have lowered returns, but their impact depended on the amount of your total investment and how much your broker charged. For example, a $400,000 portfolio would be dragged down less by a $24 commission than a $20,000 portfolio. Since 2010, we've been using real money (beginning with $60,000 in each portfolio,) and included all such real-world costs in our performance calculations.
Before we began investing real money in 2010, our performance calculations were based on owning fixed allocations to funds, for example, 5% in XYZ fund and 10% in ABC fund. In reality, such percentages would change day to day, based on relative performance; after the first month, we may really have 11% in fund ABC and 4% in XYZ. At that time, we didn't consider these changes in our performance, partially because doing so would create performance gaps compared to what new subscribers would see with their real money portfolio allocated at the then current percentages.
With our move to real money, we now reflect such out-of-balance swings in our returns. The effect of using official allocations in performance calculations was as if you had rebalanced your portfolio to the allocations listed on our site each month, which, in practice, would have caused tax implications and extra fees with some funds.
We traded to minimize short-term taxable gains (taxed at a higher rate) and fees. Many mutual funds charge short-term redemption fees, and many brokers tag on their own. We owned funds long enough to avoid these fees, but those following our portfolios could have been hit with extra fees and commissions if they added certain positions shortly before we sold the stakes, whereas we, as longer-term investors, would not have been affected. While we noted in many cases where such fees would apply the benefits of holding the position longer, this may have led to some investor returns experiencing fee drags that we would not have felt. This same phenomenon can still take place with our new real money portfolios.
More broadly speaking, if an investor were to take on more risk and, say, switch to our more aggressive portfolio after a big run up in stocks, then cut back on risk following a slide in stocks, or simply add more money after a good run, it would be possible to underperform our returns in much the same way investors typically underperform the official performance statistics of a fund’s long-term return by bad timing.
And as always, past performance is not a good indication of future returns. More specifically, we may not be able to beat the S&P 500 by as wide a margin going forward, if for no other reason than the S&P 500's history of consistently beating most other funds.
1 COMMENTS POST A COMMENT

Nice return!